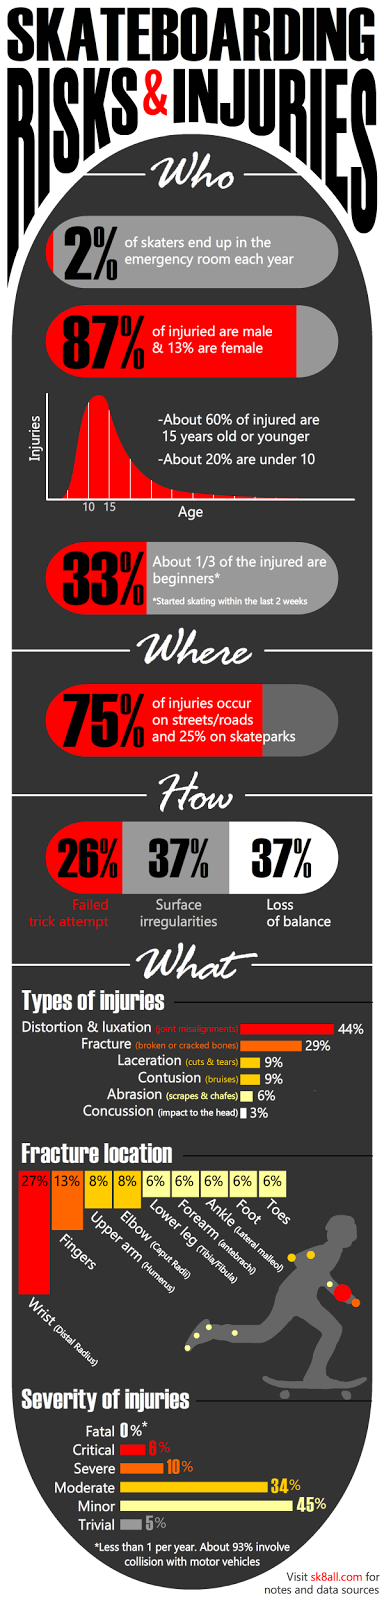
Skateboarding risks and injury stats infographic
There isn't a lot of data on skateboarding injuries out there, mostly bits and pieces in various sites. I gathered all the stats I could find in this infographic.
The major take-away for me was that wrist guards and staying away from traffic can really improve one's odds of staying in one piece. Enjoy, and don't break a leg!
Notes:
-This infograph presents data from various years and periods within the last decade. When there was data available from multiple years, I used their average.
-In the "fracture locations" section, the total of all the percentages add up to 86%. The remaining 14% is all the other bones combined.
Data sources:
-https://www.statista.com/stati
-https://www.ncbi.nlm.nih.gov/
-http://orthoinfo.aaos.org/topi
-http://physioworks.com.au/
-http://5ones.com/shred-or-die-
-http://www.

Fantastic blog indeed. Keep up the good work.
ReplyDeleteOpen Patella Knee Support Brace
Happy with the info. Keep it up.
ReplyDeleteBest Wrist Support Braces